Semantic Phasor Embeddings: Mid-Point Update
ACS research team discusses their midpoint findings for the Semantic Phasor Embeddings project.
ACS awardees: Molly Des Jardin, Scott Enderle, Katie Rawson (University of Pennsylvania)
Much recent discussion of quantitative research in the humanities has concerned scale. Confronted with the vast quantities of data produced by digitization projects over the last decade, humanists have begun exploring ways to synthesize that data to tell stories that could not have been told before. Our ACS project aims to make that kind of work easier by creating compact, non-expressive, non-consumptive representations of individual volumes as vectors. These vectors will contain information not only about the topics the volumes cover, but also about the way they order that coverage from beginning to end. Our hope is that these representations will allow distant readers to investigate the internal structures of texts at larger scales than have been possible before. But now that we've reached the midpoint of our work, our preliminary results have led to some surprising reflections about scale at much smaller levels.
Order and Scale
In our approach to the problem of creating document vectors, we use existing methods to create word vectors, and we then aggregate the vectors for each word in a given text. A simpler method than ours might aggregate the vectors by averaging them together, losing word order information; a more complex method than ours might aggregate the vectors by passing them through a neural network model, producing powerful but opaque document representations. To preserve both word order information and transparent, interpretable document features, we pass the vectors through a Fourier transform, and preserve the top ten frequency bands.
Although Fourier transforms have been used in the past by other projects for the purpose of smoothing out noise, our aim is different. (Indeed, if we could preserve all frequency bands without breaking the HathiTrust terms of service, we would!) Instead, we use Fourier transforms to create orthogonal representations of fluctuations at different scales, called phasors, which can be added and subtracted in structure-preserving ways. The mathematical properties of phasors make them well suited for the same kinds of algebraic manipulations that allow word word vectors to represent analogies.
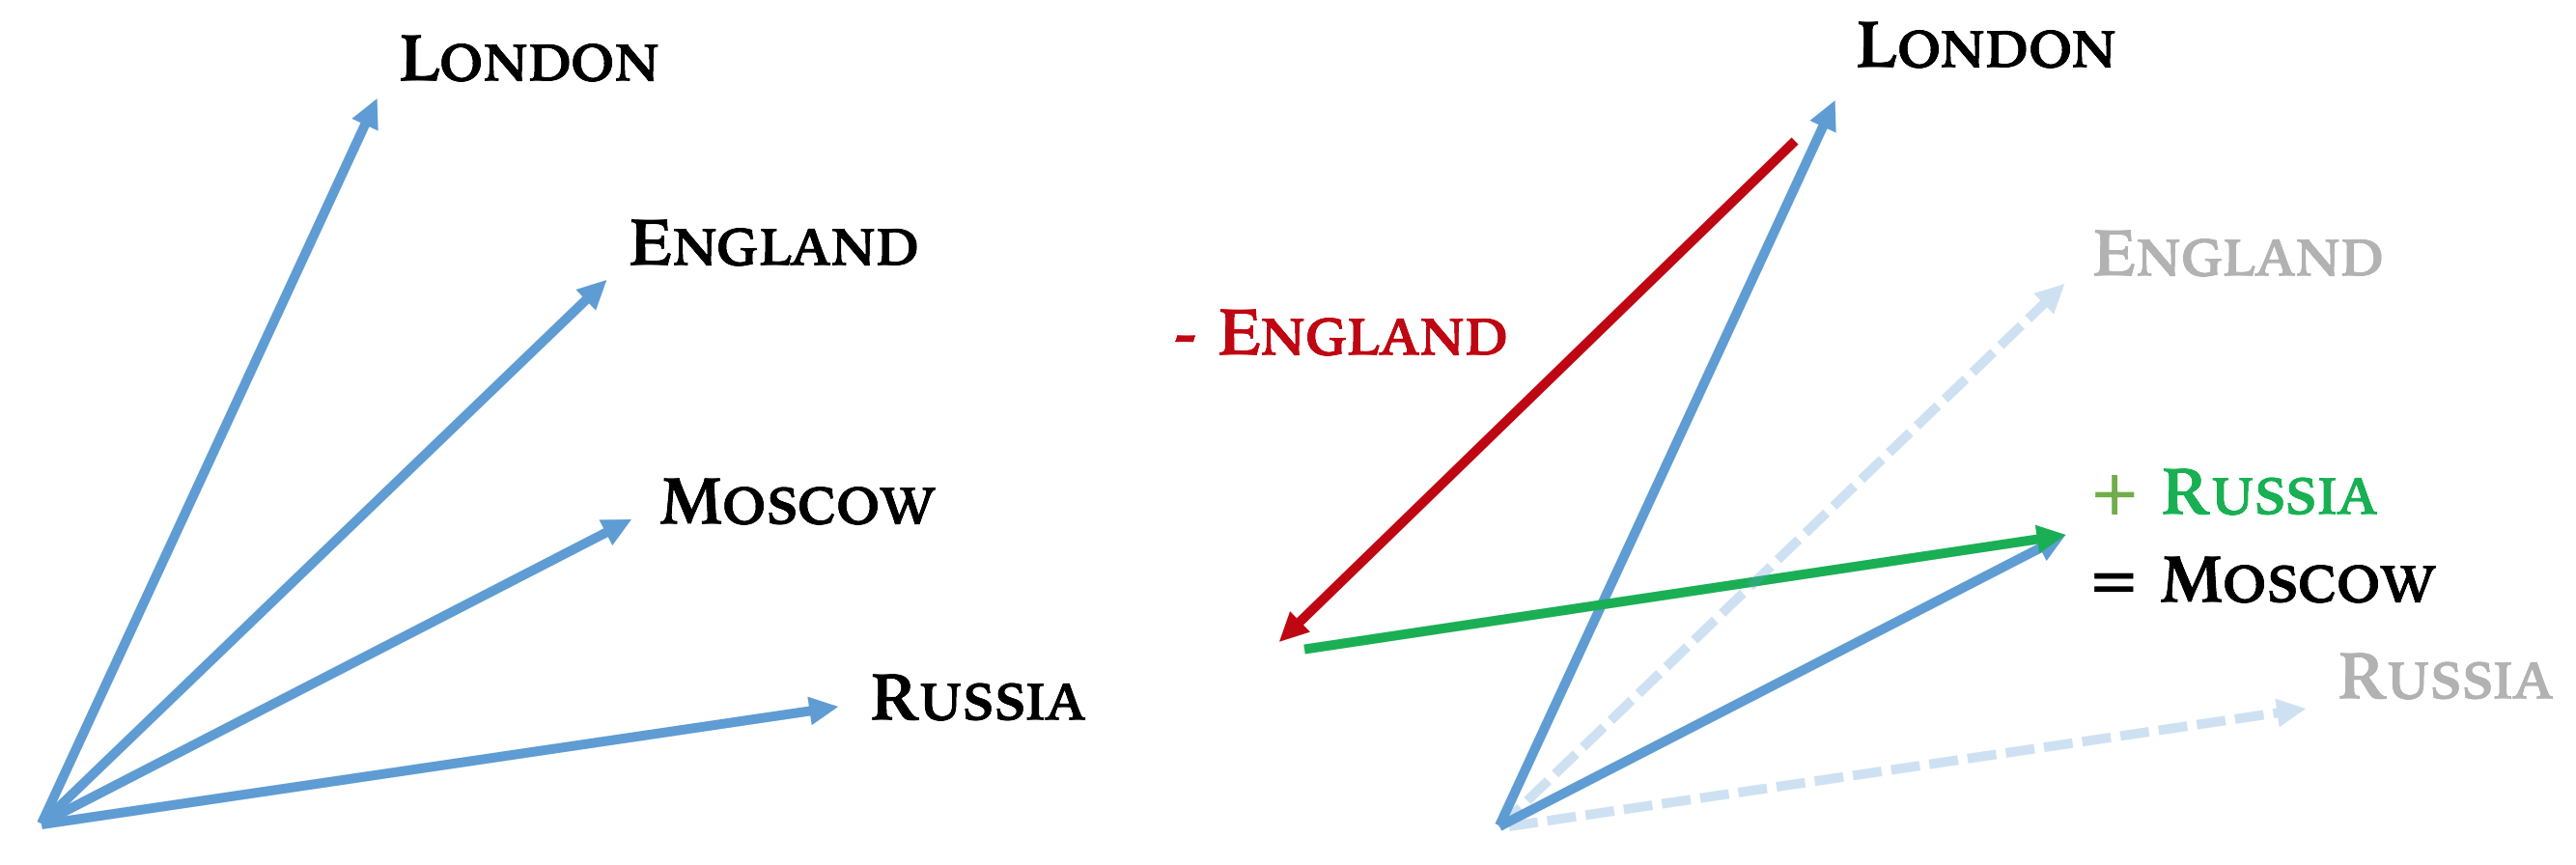
Left: word vectors for London, England, Moscow, and Russia. Right: the vector operations representing an analogy.
Just as word vectors allow us to express the idea that Moscow is to Russia as London is to England using a mathematical equation – London - England + Russia = Moscow – phasors might allow us to represent structural analogies between texts, identifying documents that discuss different topics using the same underlying organization.
What counts as a duplicate?
As an initial test case for the usefulness of these vectors, we decided to see whether they make content-based deduplication easier. It's well known that HathiTrust data contains many duplicates, and because the metadata accompanying the volumes is not consistent, it can be challenging to identify duplicates based on metadata alone.
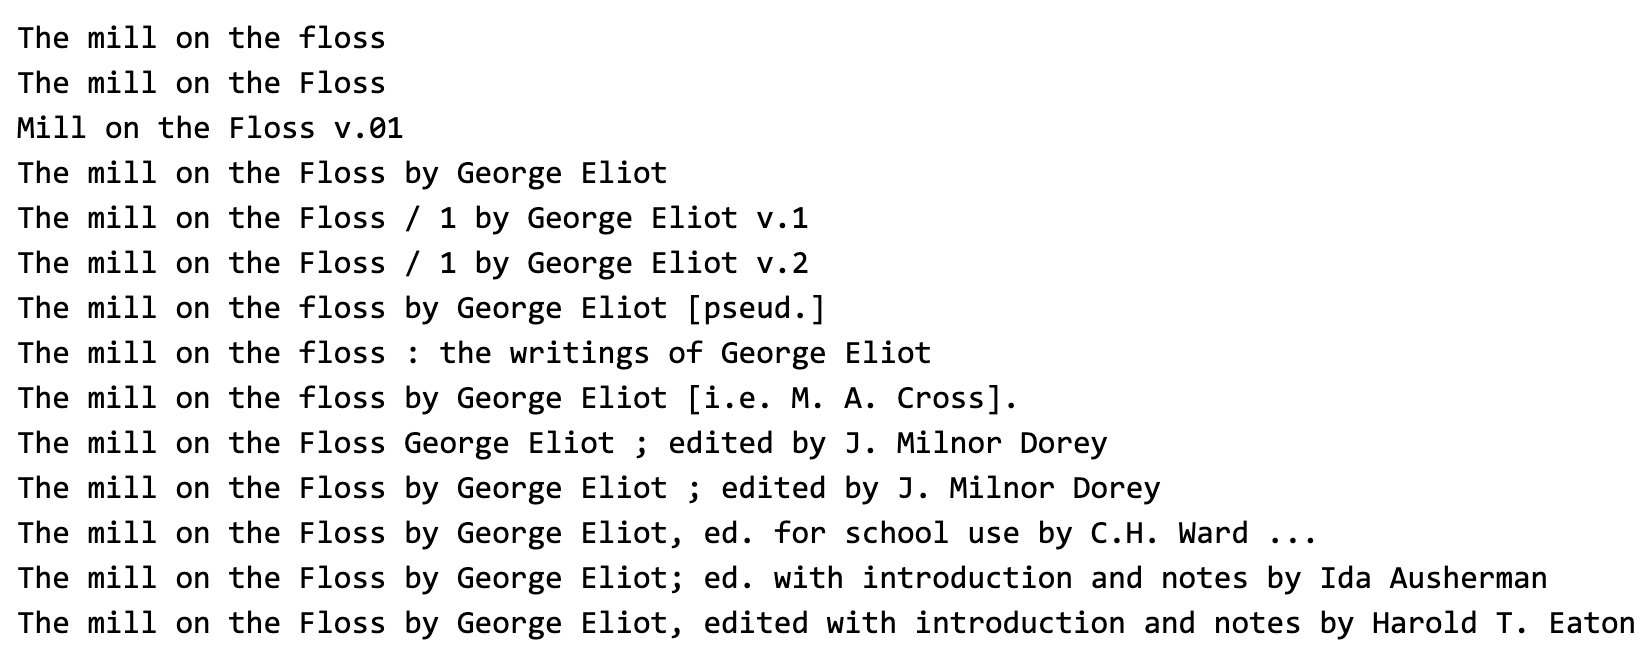
Examples of potential duplicate volumes
An ideal solution to this problem would be to examine the volumes themselves, looking for similar content. We could identify duplicates even in the total absence of metadata. But this line of thought raises a surprisingly difficult question: what counts as a duplicate?
It's easy to test two strings of characters for strict equality, but that gives a definition of duplication that is too narrow. Given differences in image and OCR quality, even two scans of the very same physical book aren't likely to have strictly identical text in HathiTrust. And while there are fuzzier ways to measure string similarity, they tend to become computationally expensive for documents longer than a few pages.
It's also relatively easy to compare character or word n-gram frequencies between volumes, and most practical content-based de-duplication schemes use that approach. Texts are represented in a vector space with a dimension for each n-gram, and points that are close together in the space are likely duplicates. But this gives a definition of duplication that is too broad. Since it pays no attention to the order of the words in documents, it can place two very different texts right next to each other if they happen to use similar words and phrases.
In a corpus that contains a hundred volumes with just a few duplicates, the n-gram frequency approach might capture all the duplicates, but it would probably also identify ten times as many candidate pairs as true duplicate pairs. That's still better than nothing; it's far easier to check fifty pairs than five thousand pairs. But it isn't ideal, and it gets worse as the corpus gets bigger.
How can we do better? It might seem at first that we could add more information, perhaps in the form of larger n-gram windows, for example. But in fact, after a certain point, adding more information will make things worse, at least if the information comes in the form of additional independent dimensions. In very high-dimensional space, the distance between points becomes more and more narrowly distributed, so that most points are about the same distance from one another. Even very complex datasets start looking like smooth, round balls. This makes it increasingly hard to distinguish between points that are close to each other for interesting reasons, and points that are close to each other by pure coincidence. (For the mathematically inclined, this phenomenon is called concentration of measure.)
Given these challenges, paying attention to word order seems like a promising strategy. And our preliminary results provide some confirmation of that hunch.
But there is a catch. Word order alone is not enough.
Testing semantic phasors
For our tests, we began with a random sample of one thousand volumes from fiction in HathiTrust, to which HTRC’s Ryan Dubnicek had added a light sprinkling of duplicates. We tested our phasors against the simple averaging method mentioned above as an order-unaware baseline. For both the baseline vectors and the phasors, we followed a three-step process. First, we created the vectors themselves. Second, we performed a secondary dimension-reduction step, using Uniform Manifold Approximation and Projection (UMAP) to project the vectors for each document into a ten-dimensional space. And third, we used a data structure called a k-d tree to perform efficient nearest neighbor queries in the UMAP-reduced space.
To calculate test statistics, we needed to decide how to count the number of true and false positives and negatives. Since duplicate volumes come in pairs, it makes sense to consider not the number of volumes in the dataset, but the number of possible pairs of distinct volumes, disregarding order. In other words, we should count all pairs [A, B] that could be selected from the dataset, treating the pair [A, B] as identical to the pair [B, A].
We started with 1,048 volumes, so the number of possible pairs is ((1,048 ** 2) - 1,048) / 2) = 548,628. Among those, only 32 pairs are duplicates that we intentionally added. So assuming there are no other unexpected duplicates in the randomly selected data, a perfect de-duplicator would be able to pinpoint the 32 pairs without including any other pairs.
Our baseline vectors were able to identify all 32 duplicates successfully. However, they also incorrectly identified at least one hundred candidate pairs for each correct pair. In other words, although they identified every duplicate pair, they also produced about 3,000 false positives, all of which would need to be weeded out by another method.
Our initial simple phasor approach also identified all 32 duplicates successfully. Unfortunately, they did even worse than the baseline vectors when it came to false positives, producing closer to 3,500 pairs that would need to be weeded out.
We did find that we could tweak our simple phasor approach to do a bit better than the baseline if we allowed for some false negatives. In other words, if you don’t need to identify all duplicates, our simple approach achieves a better balance of false negatives and false positives than the baseline. But the improvement was very small, and still produced a substantial number of false positives — about ten for every true positive. So we were unsatisfied with this result.
We tried a few different things before finding a dramatically better method. It was able to identify 31 of 32 duplicate pairs, and produced just 9 false positives. Furthermore, when we examined those 9 false positives, we found that just one was indeed a false positive. All of the other eight were duplications that had occurred in the original random dataset by pure chance.
Like our original strategy, this de-duplication strategy uses phasors to track word order. But here, we don't throw all the information from a given text together into one single vector. Instead, we create separate vectors, one for each of the five lowest Fourier frequency bands. For each band, we gather the vectors for all the texts, and create a separate ten-dimension, UMAP-reduced space. And we stipulate that two texts that are close to each other in all five spaces are duplicates. That last requirement makes the difference. It produces almost perfect accuracy, reducing both the false positive and false negative rate nearly to zero, focusing sharply on duplicates alone. If we relax that requirement by defining duplicates as texts that are close to each other in only some of these spaces, we start getting false positives.
This dramatic improvement may tell us something interesting about what it means for two texts to be duplicates of one another. It suggests that the best definition of duplication involves comparisons between texts not only in terms of word order, but also in terms of scale. Duplicates are documents that are similar to each other at multiple scales.
The phasors representing the lowest frequency contain information about the largest structures of the text. In a three-act play, they would tell us about the content of each act. At progressively higher frequencies, the phasors contain information about progressively smaller textual structures — from acts to scenes, and from scenes to lines. This separation of phenomena according to scale would not have happened had we not begun with Fourier transforms. So in a sense, this is a happy accident. We started out hoping to capture important information about word order, but we wound up capturing even more important information about scale.
Scale-free Reading
Might these findings provide hints about how to solve other kinds of problems? Looked at from one perspective, a text de-duplicator is like a very, very specific binary classifier. Its training input consists of a single text, and it learns to divide texts into two categories, duplicates and non-duplicates. It seems possible that the strategies we used here might be useful for other kinds of classification problems. For example, could we classify texts into microgenres based on multi-scale similarity? We will be investigating that particular question as our work on this project continues.
More broadly, this line of speculation could be relevant to the conversations about scale and distant reading that this post began with. To identify duplicates, we found that it was necessary to measure and compare textual features at multiple scales; looking at just one scale wasn't enough. Suppose this logic applies not only to individual texts, but to the social systems that produce them. If that is the case, then neither close nor distant reading should be privileged over the other. And if we can integrate close and distant reading into an overarching methodological framework, we may find that a range of important cultural phenomena come into newly sharp focus.

